Analytics
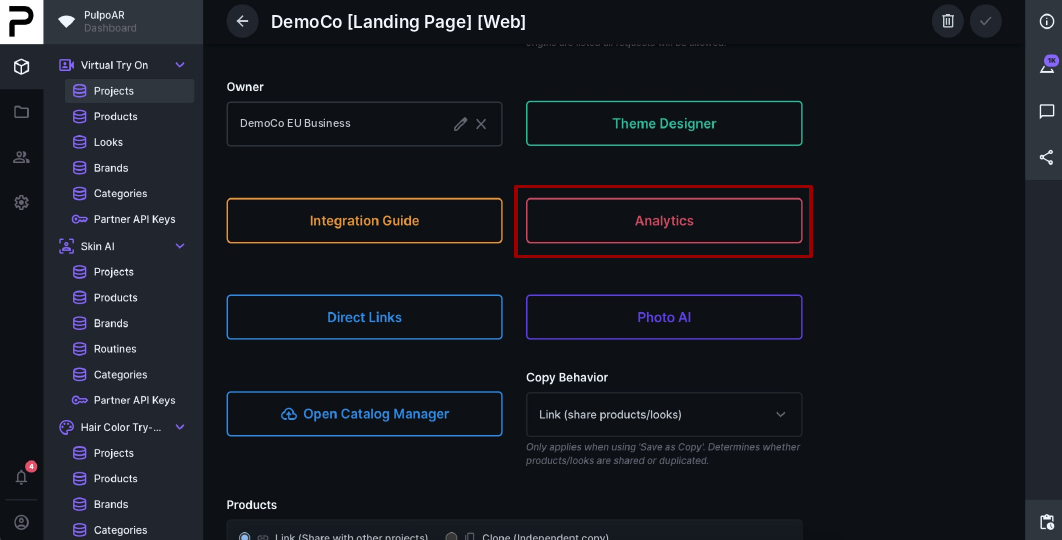
Analytics shows how customers use your experience once it's live. Open it with the Analytics button on your project page.
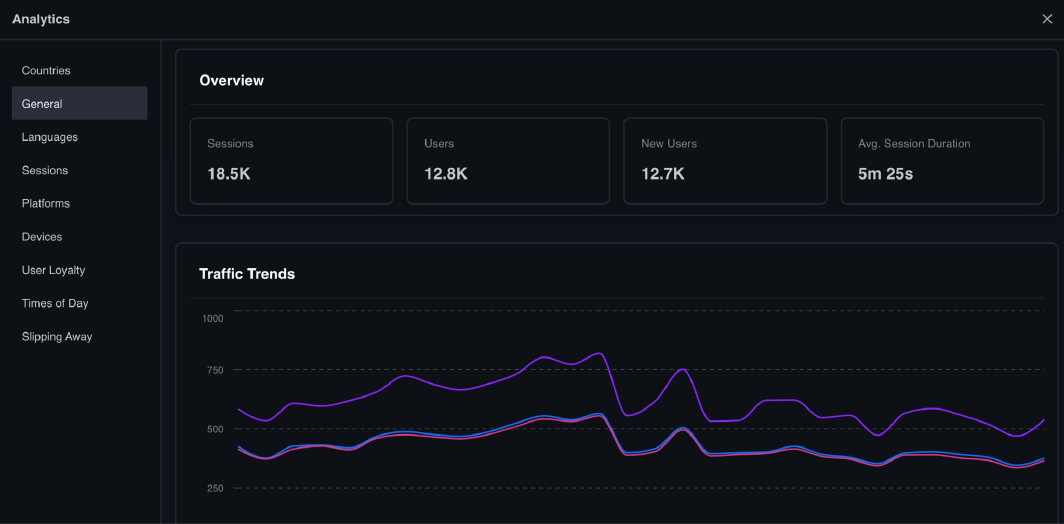
Pick a date range at the top, or a preset such as Last 7 days or Last 30 days. All tabs use this range.
Tabs
| Tab | What it shows |
|---|---|
| General | Sessions, users, new users and average session length, plus traffic trends and key events (Ready, Add to Cart, Go to Product) |
| Countries | Where your users are |
| Languages | The languages your sessions run in |
| Sessions | Daily sessions, new users and unique users |
| Platforms | Operating systems: iOS, Android, Windows, macOS, Linux |
| Devices | Mobile, desktop and tablet, plus top devices and screen sizes |
| User Loyalty | Users grouped by how many sessions they've had |
| Times of Day | Activity by day of the week and hour |
| Slipping Away | Users who haven't come back in 7, 14, 30, 60 or 90+ days |
Export to Excel
You can download your analytics as an Excel file.
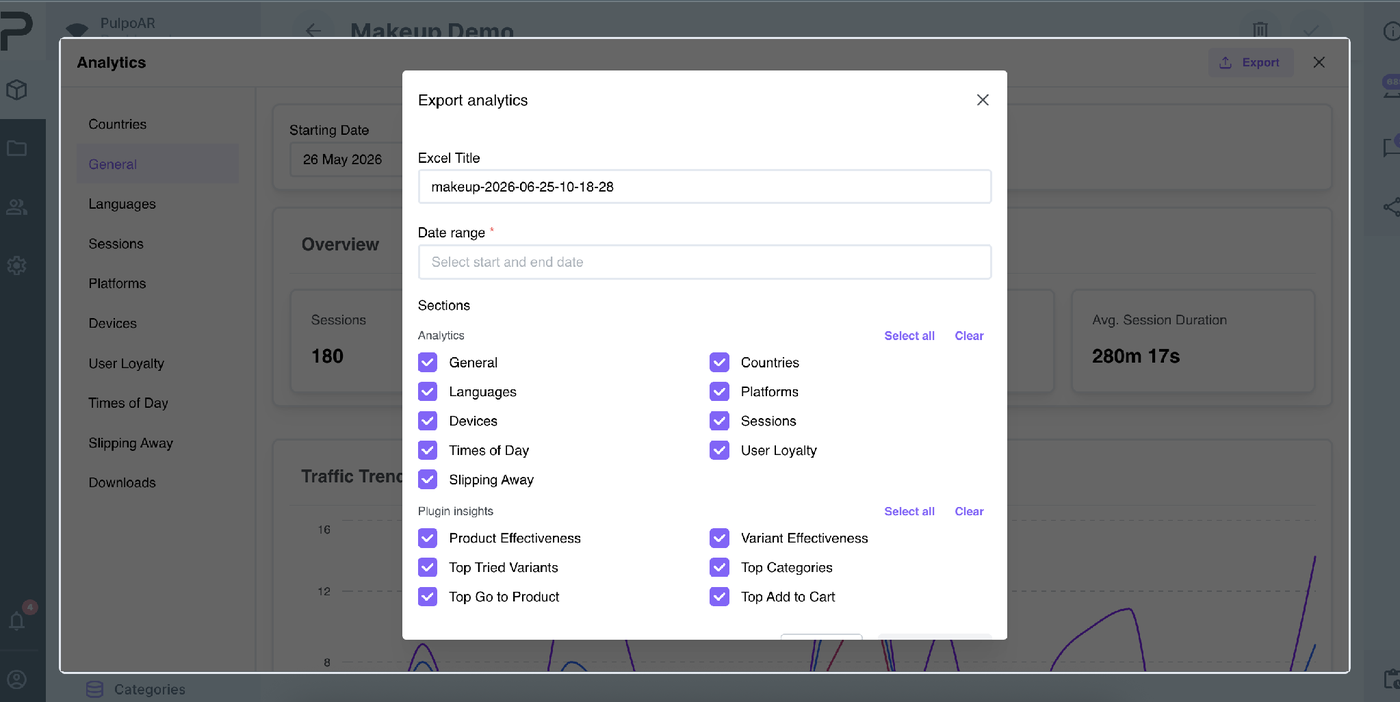
- In Analytics, click Export at the top right.
- Optionally rename the file.
- Choose a date range (required).
- Choose what to include:
- Analytics: the dashboard tabs above.
- Plugin insights: product and variant effectiveness, top tried variants, top categories, top Go to Product and top Add to Cart.
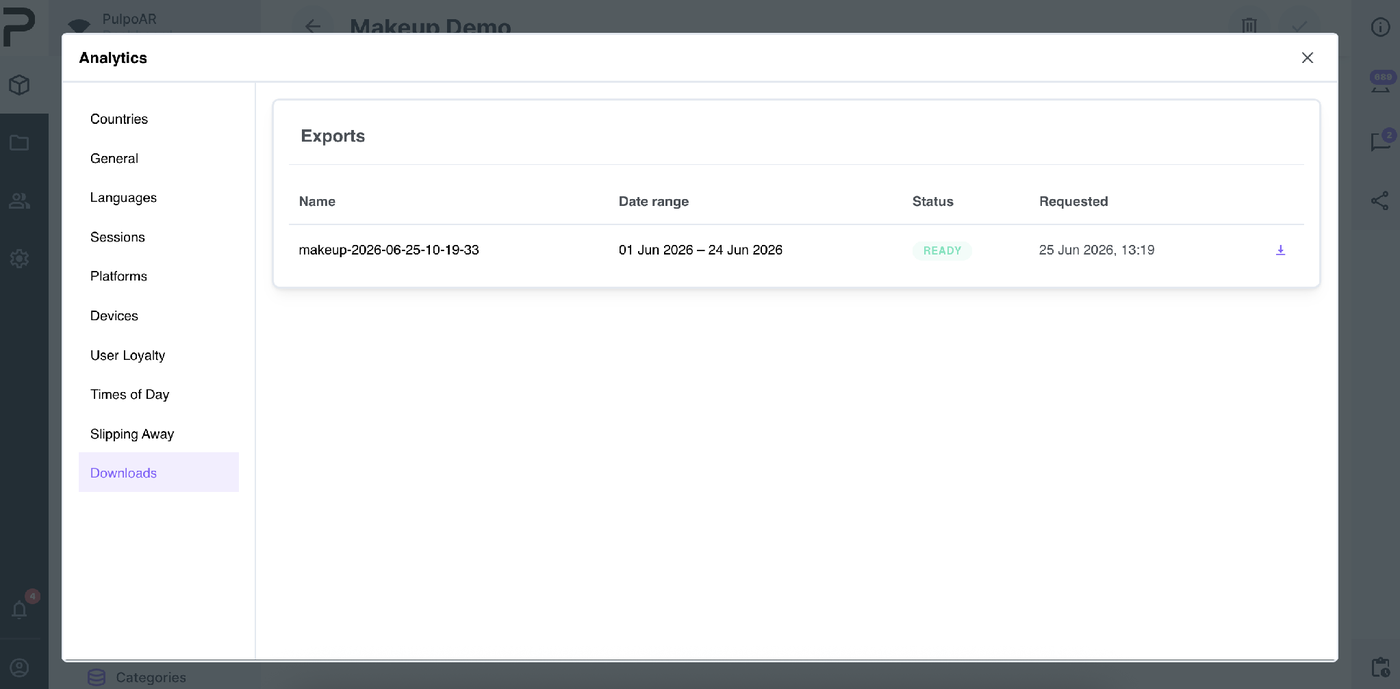
- Click Start export. You're taken to the Downloads tab.
- When the status changes from Processing to Ready, click the download icon.
Exports run in the background, so you can leave the page. Longer date ranges take longer.
What's in the file
Each sheet starts with a short description. The file includes:
- Summary: headline totals and rates, for example add-to-cart rate.
- Daily, weekly and session trends.
- One sheet per key event: Ready, Add to Cart, Go to Product, activity.
- Product and variant effectiveness: which products and shades convert best.
- Top lists: categories, tried variants, Go to Product and Add to Cart.
- Breakdowns: countries, languages, platforms, devices and screen sizes.
- Times of Day, User Loyalty and Slipping Away.
Tips
- For product and merchandising reviews, include Plugin insights. It's the closest thing to a per-product performance report.
- For retention, use a longer range, for example 90 days.
Automate this
To pull analytics into your own dashboards automatically, your developers can use the Analytics API.